Setting Up An ELK Stack for IRC Logs: Part Three
This post will outline upgrading to Logstash 2.1.x and getting Kibana setup to visualize our logs.
Alright, time to wrap up this quest to create an ELK stack for our IRC logs. We will finish up our cluster by setting up Logstash to index logs to our Elasticsearch cluster constantly and stand up Kibana in order to visualize our log data.
Logstash
First thing we’ll need to do is finishing up our Logstash configuration. In the first post of this series, we got Logstash up and running and outputting our logs to stdout. Since the writing of my first post, the Logstash version has changed, which I addressed in part two of this series. That being said, we’ll proceed as follows:
- Update Logstash and fix breaking changes
- Index Logstash output in Elasticsearch
- Run Logstash as a daemon on our server
Logstash 2.1
In order to use the latest and greatest that elastic.co has to offer, we need to upgrade our Logstash version. You can follow all of the instruction in Matt’s post I linked to in my first post, but make sure that you install Java 8 and change the Logstash download URL to: https://download.elasticsearch.org/logstash/logstash/logstash-2.1.1.tar.gz.
Like many major upgrades, logstash-2.x introduced breaking changes. Unfortunately, it has broken the configuration template used in my first post. When I updated Logstash and ran against my configuration, I saw several errors:
Failed parsing date from field {
:field=>"message_timestamp",
:value=>"2016-01-03;%{time}",
:exception=>"Invalid format: \"2016-01-03;%{time}\" is malformed at \"%{time}\"",
:config_parsers=>"YYYY-MM-dd;HH:mm:ss",
:config_locale=>"default=en_US",
:level=>:warn}
From the error I was able to tell that the time was either not being parsed correctly or not being substituted correctly. I began by researching the latter, thinking that the semicolon may be a special character. I tried using a comma, other special characters, even no character at all – to no avail. Must be something to do with parsing… If you recall from the first post, we detected a _grokparsefailure as a sign that the log was an IRC system log and we should drop it because we’re not interested in indexing those logs. I was able to see that these logs were leaking through somehow. Lo and behold, after checking the breaking changes for logstash-2.1.x, they had dropped support for tags in the output and filter plugins. I’m not quite sure of the reasons behind this change, but I have to guess that it may be trying to prevent exactly what I did. It is not good practice to ignore a log that fails to parse. Rather, you should understand what a malformed, or uninteresting, log might look like and drop it based on that knowledge. In our case, this is a straightforward fix. If some person (or bot) didn’t say it, then we’re not interested. Therefore, if a log does not contain a username field, we can ignore that log. Our updated filter will be as follows:
filter {
  grok {
    match => {
      "message" => [ "\[%{TIME:time}\] \<%{GREEDYDATA:username}\> %{GREEDYDATA:msg}" ]
    }
    match => {
      "path" => [ "%{UNIXPATH:location}\/%{GREEDYDATA:znc_user}_%{GREEDYDATA:network}_#%{GREEDYDATA:channel}_%{YEAR:year}%{MONTHNUM2:month}%{MONTHDAY:day}" ]
    }
    break_on_match => false
  }

  # No username, no log!
  if ![username] {
    drop {}
  }

  mutate {
    add_field => { "message_timestamp" => "%{year}-%{month}-%{day};%{time}" }
  }

  date {
    match => [ "message_timestamp", "YYYY-MM-dd;HH:mm:ss" ]
    target => "@timestamp"
  }

  mutate {
    remove_field => [ "message_timestamp", "year", "month", "day", "time" ]
  }
}
Note: There is an additional update to this file. MONTHNUM was updated to MONTHNUM2 to handle double digit months, which is what the IRC log file naming convention uses.
Sending Logs to Elasticsearch
This step is pretty easy. We just need to configure Logstash to send logs to Elasticsearch. The only difference here will be whether you’re using the public or private networking interface. Either way, you’ll need to allow incoming traffic on port 9200. If you remember, this is the port that provides the interface to the Elasticsearch API, which Logstash leverages to index logs.
sudo iptables -A INPUT -i (eth0/eth1) -p tcp --dport 9200 -m state --state NEW,ESTABLISHED -j ACCEPT
Make sure that if you’re using private networks, you make sure to add the node that Logstash will be running on to that network!
Now, we’ll just need to update our output configuration in our Logstash config file:
output {
  elasticsearch {
    # can be any (or all) elasticsearch node(s) in your cluster
    hosts => [ "192.168.3.5:9200" ]
    # choose your index name
    index => "irc"
  }
}
Now, let’s make sure everything is working:
logstash@node:~/logstash-2.1.0 $ bin/logstash -f logstash_config
Settings: Default filter workers: 1
Logstash startup completed
From an Elasticsearch node:
elastic@node-1 $ curl 192.168.3.5:9200:9200/_cat/indices
green open irc 5 1 7 0 71.4kb 35.7kb
Logstash As a Daemon
OK, now we have Logstash working, but it’s taking up our stdin. Let’s setup an init script for Logstash to run.
We’re going to use this init script. I had to make a couple changes to the script, but in general, we’ll be setting up our box to utilize this script.
# Let's move our logstash folder to /opt/logstash
logstash@node:~ $ sudo mv logstash-2.1.0/ /opt/logstash
logstash@node:~ $ cd /opt/logstash

# Move our config
logstash@node:/opt/logstash $ sudo mkdir /etc/logstash
logstash@node:/opt/logstash $ sudo mv logstash_config /etc/logstash/central.conf

# Make a log file
logstash@node:~ $ sudo mkdir /var/log/logstash
logstash@node:~ $ sudo touch /var/log/logstash/central.log
Next, you need to paste the above init script to /etc/init.d/logstash using vim or the text editor of your choice.
I had to make the following change on line 27:
-  command="${logstash_bin} agent --verbose -f $logstash_conf --log $logstash_log"
+  command="${logstash_bin} agent -- --verbose -f $logstash_conf --log $logstash_log"
Here is the relevant StackOverflow post that portrays the problem with the script as is.
And this change on line 43:
-  status_of_proc -p $pid_file "" "$name"
+  status_of_proc -p $pid_file $logstash_bin $name
After referencing this article, it seems that they were using status_of_proc incorrectly.
# Make the script executable
logstash@node:~ $ sudo chmod +x /etc/init.d/logstash

# Touch the log file
logstash@node:~ $ sudo mkdir /var/log/logstash && touch /var/log/logstash/central.log

# Start the service
logstash@node:~ $ sudo service logstash start
* logstash is not running
* Starting logstash

# Check that it is actually running!
logstash@node:~ $ sudo service logstash status
* logstash is running

# You can ps aux | grep this pid if you're really paranoid
logstash@node:~ $ sudo cat /var/run/logstash-central.pid
17865

# You can stop it
logstash@node:~ $ sudo service logstash stop
* Stopping logstash
logstash@node:~ $ sudo service logstash status
* logstash is not running
Now that we have Logstash updated, outputting logs to our Elasticsearch cluster, and running as a daemon on our server, we can now set up Kibana.
Kibana
The Kibana setup is pretty easy in comparison. I decided to place Kibana on a node that was already running Elasticsearch, but you could just as easily add it to your private network or edit your iptables to talk to the Elasticsearch cluster.
First, download Kibana.
elastic@node:~ $ wget https://download.elastic.co/kibana/kibana/kibana-4.3.1-linux-x64.tar.gz
elastic@node:~ $ tar xzf kibana-4.3.1-linux-x64.tar.gz
elastic@node:~ $ cd kibana-4.3.1-linux-x64
Inside the kibana-4.3.1-linux-x64 folder, there is a file config/kibana.yml. We really just need to add our Elasticsearch URI, but there are several other options you can configure our your own.
elasticsearch.url: "http://192.168.3.1:9200"
Now, we can start Kibana.
elastic@node:~/kibana-4.3.1-linux-x64 $ bin/kibana --config config/kibana.yml
  log   [17:57:23.903] [info][status][plugin:kibana] Status changed from uninitialized to green - Ready
  log   [17:57:23.939] [info][status][plugin:elasticsearch] Status changed from uninitialized to yellow - Waiting for Elasticsearch
  log   [17:57:23.962] [info][status][plugin:kbn_vislib_vis_types] Status changed from uninitialized to green - Ready
  log   [17:57:23.973] [info][status][plugin:markdown_vis] Status changed from uninitialized to green - Ready
  log   [17:57:23.984] [info][status][plugin:metric_vis] Status changed from uninitialized to green - Ready
  log   [17:57:23.997] [info][status][plugin:spyModes] Status changed from uninitialized to green - Ready
  log   [17:57:24.006] [info][status][plugin:statusPage] Status changed from uninitialized to green - Ready
  log   [17:57:24.017] [info][status][plugin:table_vis] Status changed from uninitialized to green - Ready
  log   [17:57:24.033] [info][listening] Server running at http://0.0.0.0:5601
  log   [17:57:29.026] [info][status][plugin:elasticsearch] Status changed from yellow to yellow - No existing Kibana index found
  log   [17:57:31.774] [info][status][plugin:elasticsearch] Status changed from yellow to green - Kibana index ready
Now, we can go see in our browser:
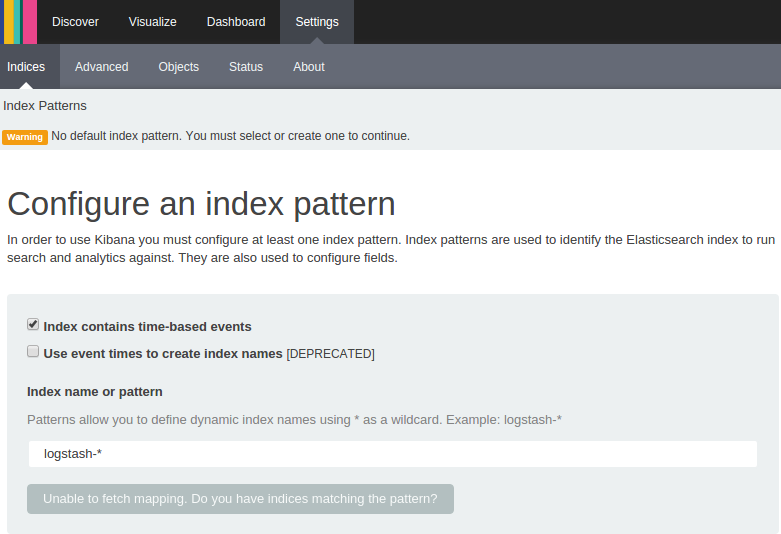
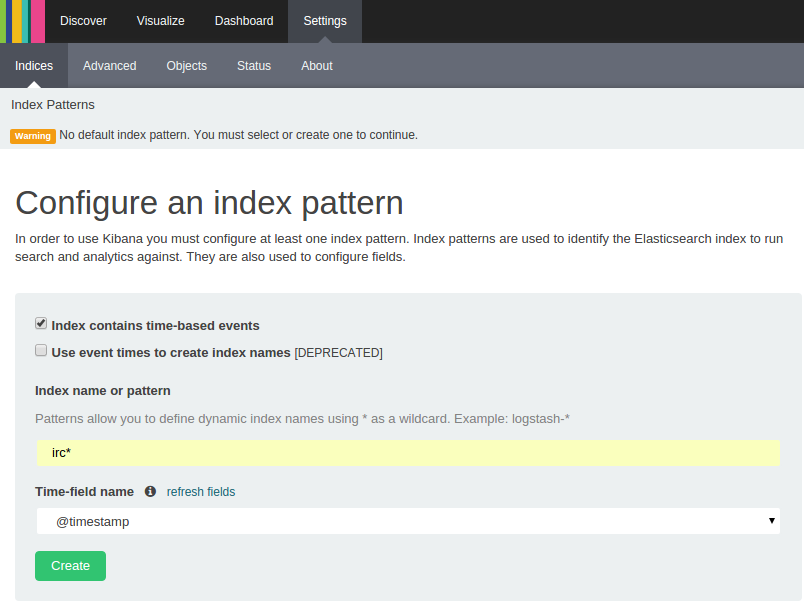
We need to setup our index according to what we output the index as in our Logstash config from above:
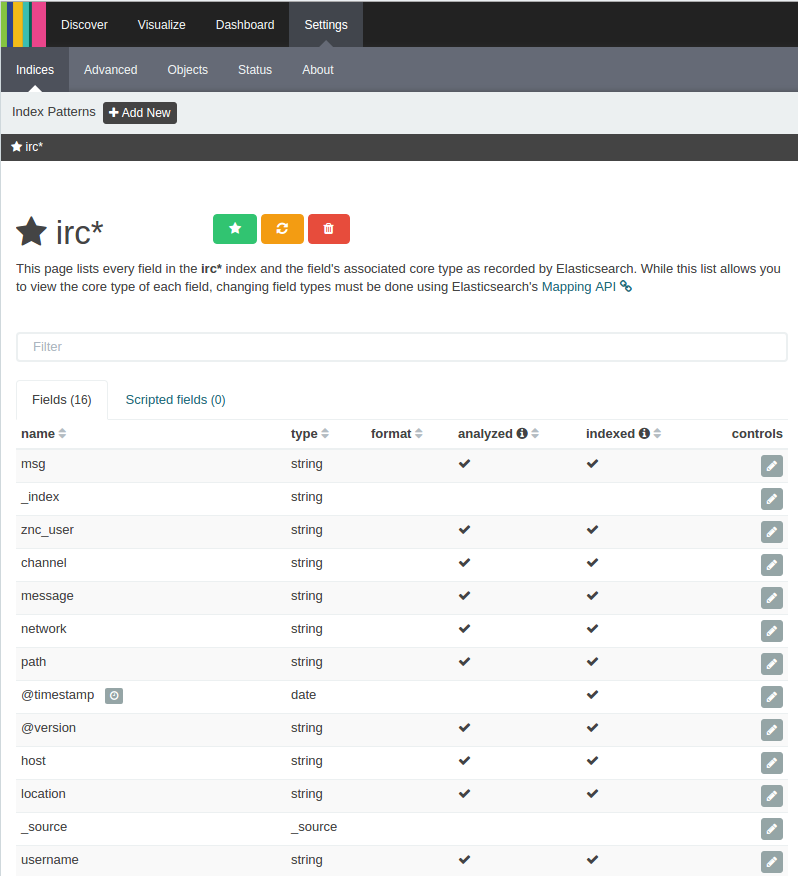
Go ahead and click ‘Create’ and we’ll be able to see all of the fields our logs have:
Now if we click ‘Discover’ at the top, we should be able to visualize logs:
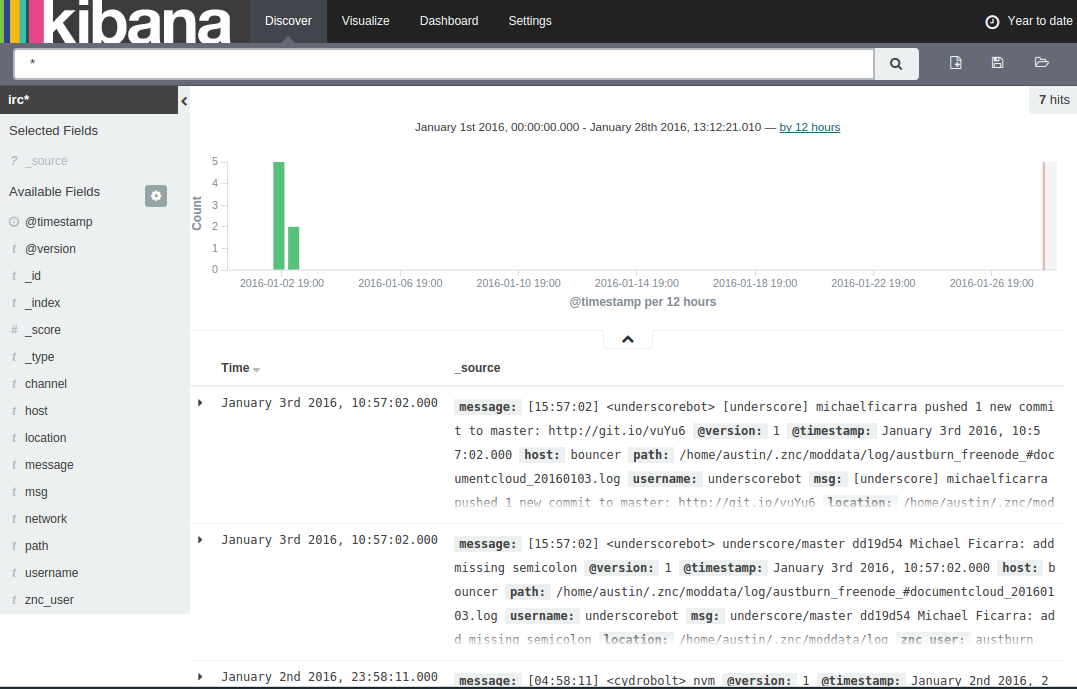 Note: If you don’t see logs, don’t fret! Kibana was obviously able to find your log index, so something should be there. Make sure you use the date selector in the top right of the UI to select a time range that suits your logs. The default is 15 minutes, so unless you have constantly flowing logs, you may not see anything initially.
Kibana Daemon
Much like Logstash, Kibana runs in the foreground. We’ll set up Nginx as a proxy to Kibana. This is so that we don’t have to run Kibana as root, which would be a security risk. Nginx also provides more flexibility and capability as a server than NodeJS (which Kibana utilizes).
# Install nginx
elastic@node:~ $ sudo apt-get install nginx

# It is installed and ran as a service by default
elastic@node:~ $ sudo service nginx status
 * nginx is running

# Disable the default site
elastic@node:~ $ sudo rm /etc/nginx/sites-enabled/default

# Create proxy for kibana
elastic@node:~ $ sudo vim /etc/nginx/sites-enabled/kibana
Here is the configuration I used for Nginx above.
Now, we’ll setup Kibana to run much like Logstash.
# Let's move our kibana folder to /opt/kibana
elastic@node:~ $ sudo mv kibana-4.3.1-linux-x64/ /opt/kibana
elastic@node:~ $ cd /opt/kibana

# Move our config
elastic@node:/opt/kibana $ sudo mkdir /etc/kibana
elastic@node:/opt/kibana $ sudo mv kibana_config /etc/kibana/default.yml

# Make a log file
elastic@node:~ $ sudo mkdir /var/log/kibana
elastic@node:~ $ sudo touch /var/log/kibana/app.log
Here is a link to my Kibana config.
Next, we’ll need to setup /etc/init.d/kibana by pasting this and making that file executable via sudo chmod +x /etc/init.d/kibana.
After that, we should be able to get Kibana and Nginx working.
# Start kibana
elastic@node:~ $ sudo service kibana start
 * kibana is not running
 * Starting kibana

# Restart nginx
elastic@node:~ $ sudo service nginx restart
 * Restarting nginx
After that last step, you should be able to see Kibana running in your browser at your server’s public IP address.
Conclusion
After this post, you should have an entire ELK stack running! In this post we were able to get Logstash running on the same server as our ZNC bouncer (or wherever your log files may reside) running as a service and shipping logs to our Elasticsearch cluster. We also setup Kibana in a similar way to get it running as a service on one of our Elasticsearch nodes so that we could visualize the data in our Elasticsearch cluster. To further enchance your cluster, you could setup Logstash to have a path regex that matches several log files in order to index more and potentially real time data into your cluster. As always, you can reach out to me via @austburn on Twitter with questions!

Share this post
Twitter
Google+
Facebook
Reddit
LinkedIn
StumbleUpon
Pinterest
Email